Scott Luntz

Scott Luntz

Sports analytics research

I research what actually drives pitching results using public Statcast data, and build tools that put those findings to work in player evaluation.

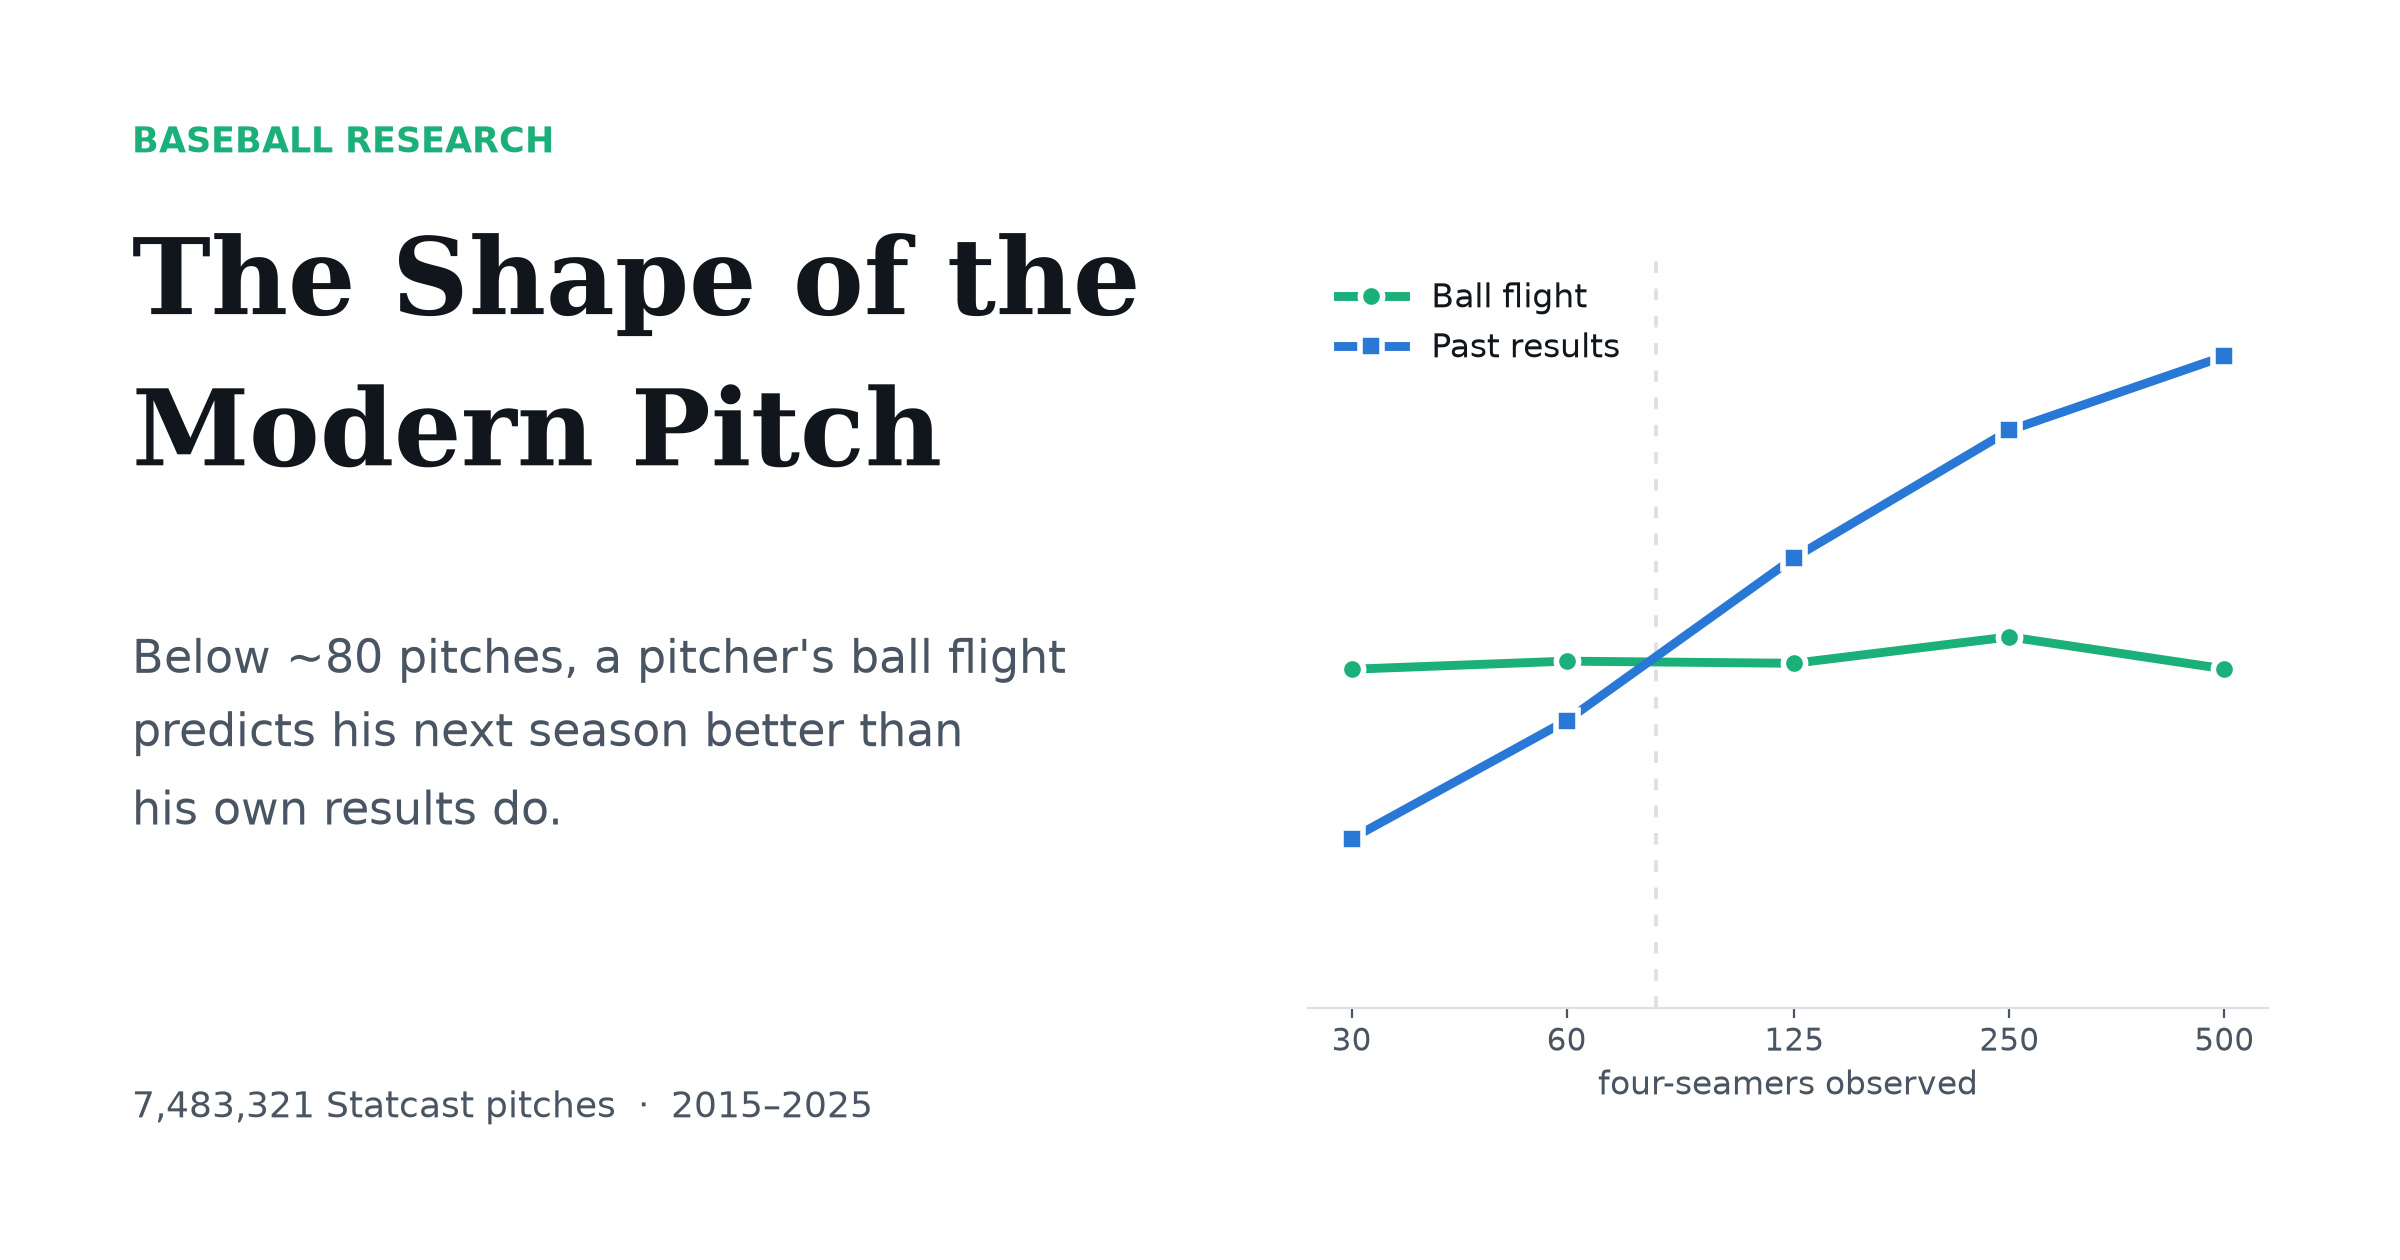
Below about 80 pitches, a pitcher's ball flight predicts his next season better than his own results do.

Ball flight against results, by pitches seen Predicting next-season whiff rate, ball flight stays near 0.19 to 0.21 from 30 to 500 pitches, while past results rise from 0.09 to 0.36, overtaking ball flight at about 80 pitches. 0 .10 .20 .30 .40 Predictive power, R² 30 60 125 250 500 Four-seam fastballs seen About 80 pitches Ball flight Results
How well each one predicts next-season whiff rate, by how many of a pitcher's four-seam fastballs have been observed. Ball flight is measured almost exactly from the first pitches, so its line stays flat; results start close to useless and only overtake it at about 80 pitches. From The Shape of the Modern Pitch.

Work

The Shape of the Modern Pitch

Research paper, August 2026

What actually drives pitch outcomes, measured across 7,483,321 Statcast pitches from 2015 to 2025.

  • Pitch shape, meaning how much the ball moves and the angle it arrives at, explains 4.5 times more of the variation in run value than velocity.
  • Spin rate adds nothing measurable to run value once velocity is accounted for.
  • Shape is measured almost exactly, with a split-half reliability of 0.99; run value per pitch is barely measured at all, at 0.20.
Pitch Shape Explorer

Interactive dashboard, 2015–2026 seasons

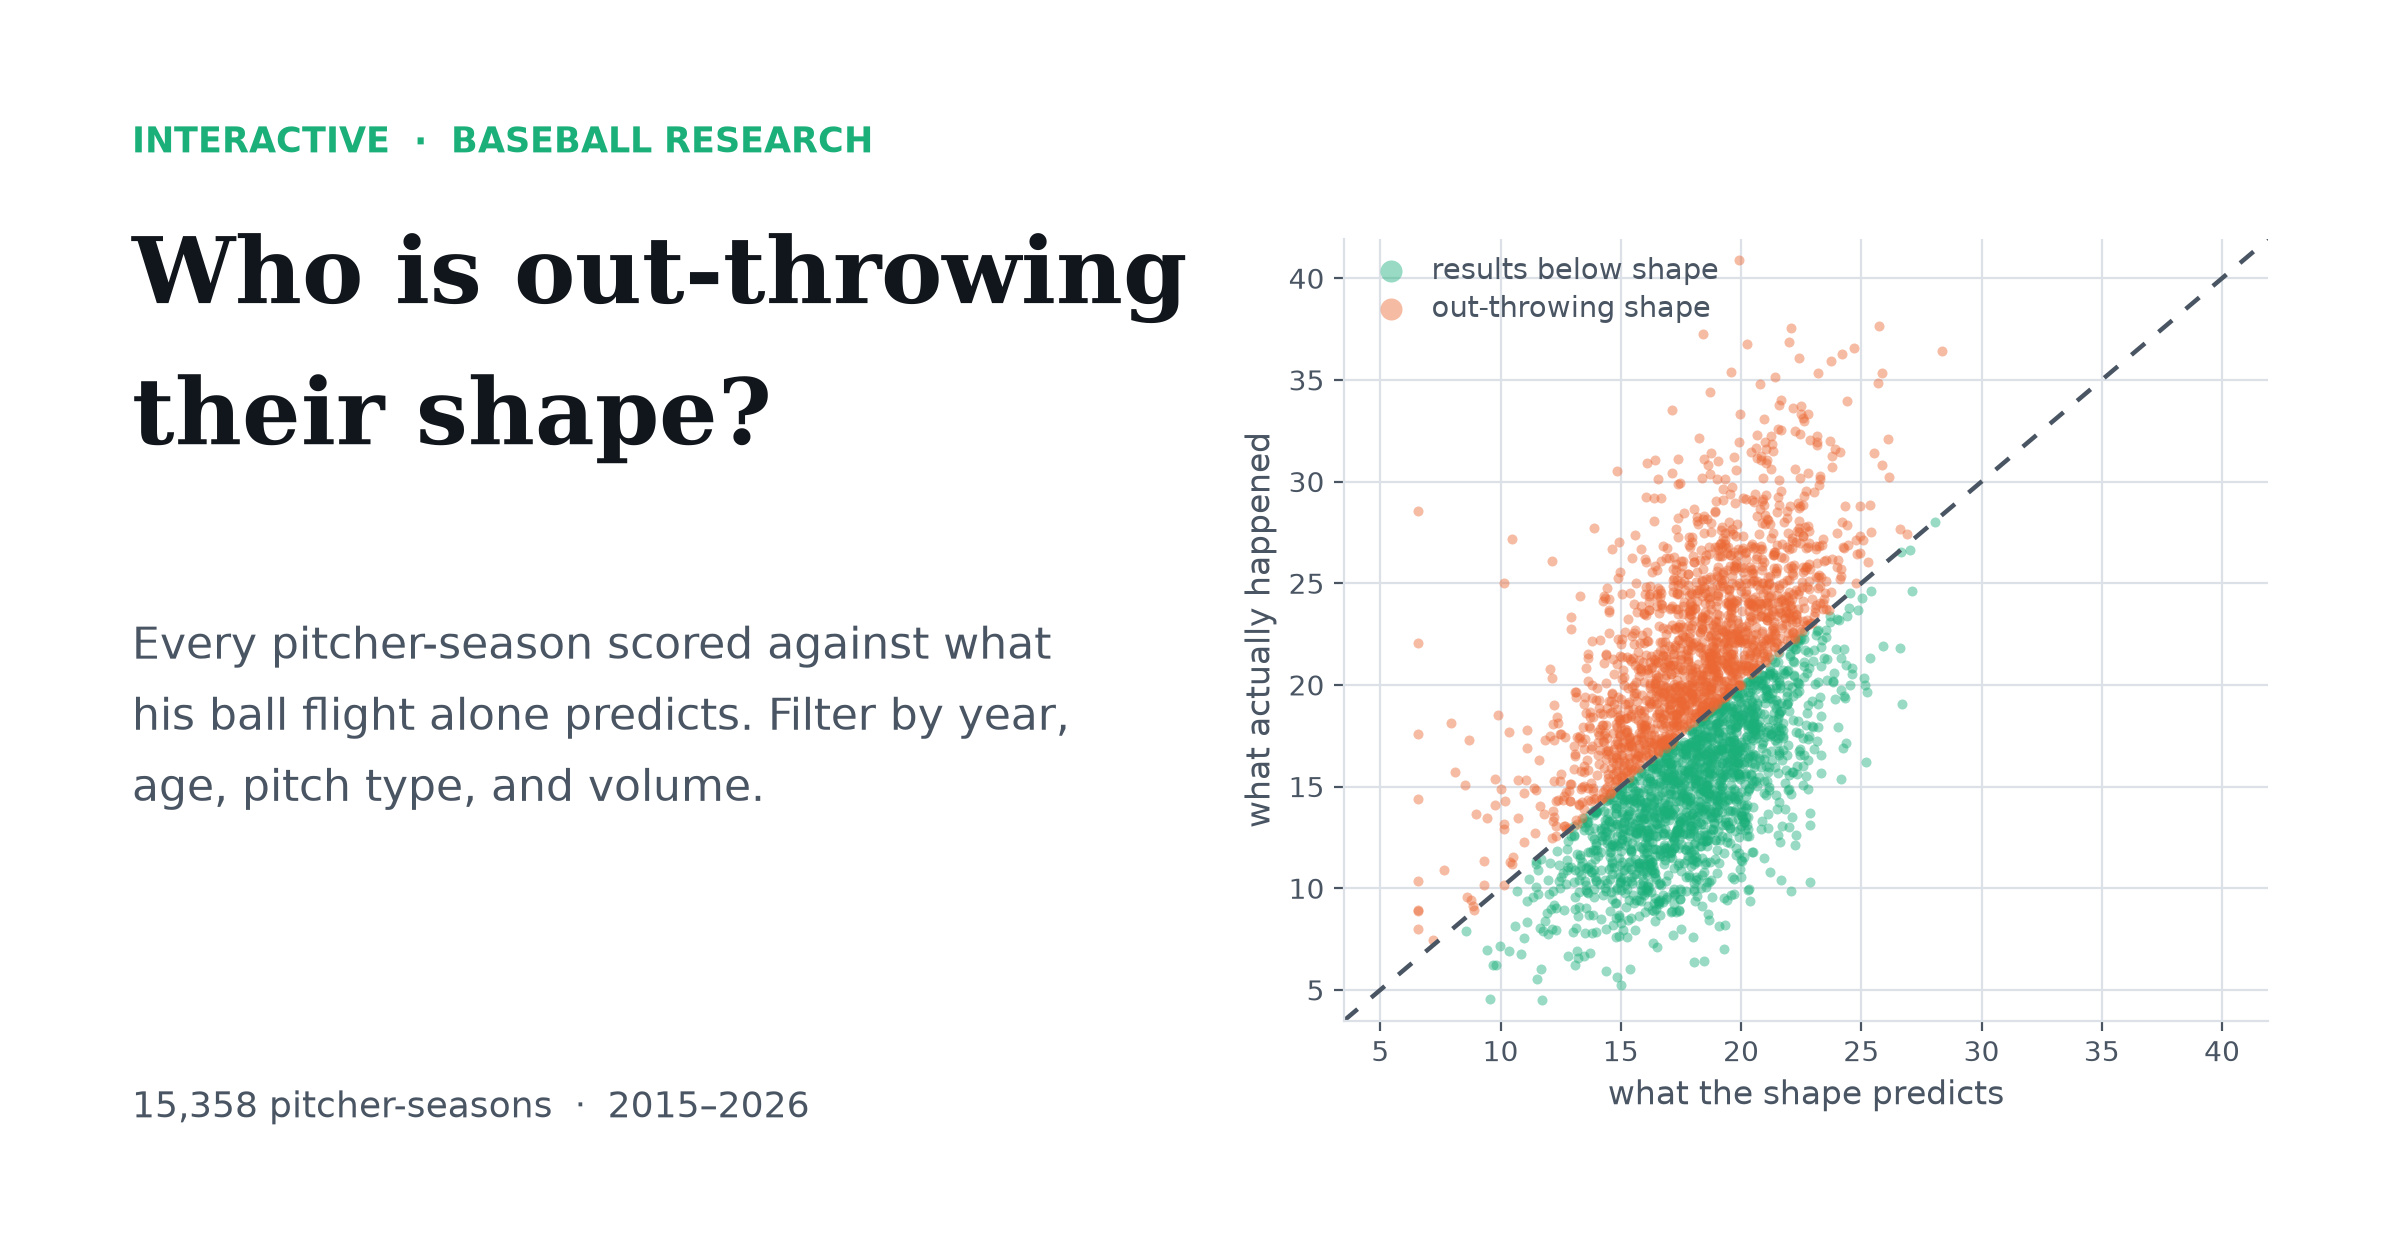
Scores each pitcher against the whiff rate his pitch shape predicts, and names the pitchers whose results are running ahead of it or behind it.

  • 15,358 pitcher-seasons, searchable by pitcher, season, age, pitch type and handedness.
  • On four-seam fastballs, beat plain regression to the mean in 9 of 9 seasons, predicting each season from only the ones before it.
  • Validated on 5 of 7 pitch types.

About

I'm a passionate baseball fan and a technologist by trade. My research asks what actually separates pitchers. Across nearly 7.5 million tracked pitches, the answer was the shape of the pitch: how much it moves and the angle it arrives at matter far more than how hard it's thrown or how fast it spins. The Pitch Shape Explorer turns that finding into a tool for evaluating pitchers, season by season.

I use AI as a core part of my research workflow, which lets me go from a question to a tested, documented answer quickly. The questions, the standard of evidence and the conclusions are mine, and the paper describes the workflow in full.

Everything here is built from public data and all of the code is open, so every number on this site can be checked.